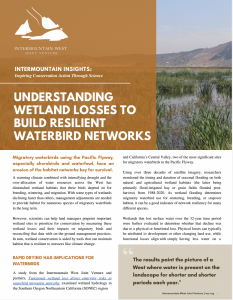
To understand how wetland drying is affecting the Intermountain West, IWJV researchers are using satellite imagery to monitor the timing and duration of seasonal flooding on both natural and agricultural wetland habitats (the latter being primarily flood-irrigated hay or grain fields flooded postharvest) from the mid-1980’s to the present-day. This data is being shared with our partners through the Wetland Evaluation Tool (WET). This spatial wetland analysis product enables users to track changes in surface water over space and time. Combined with local knowledge, the tool can help land managers create a landscape-scale picture of important areas to target for land and water conservation.
WET is supported by Google Earth Engine and is constantly evolving as data expands and the tool is updated.
Contact Patrick Donnelly, IWJV Spatial Ecologist, or Teagan Hayes, Science to Implementation Specialist, to learn more.


WET Modules
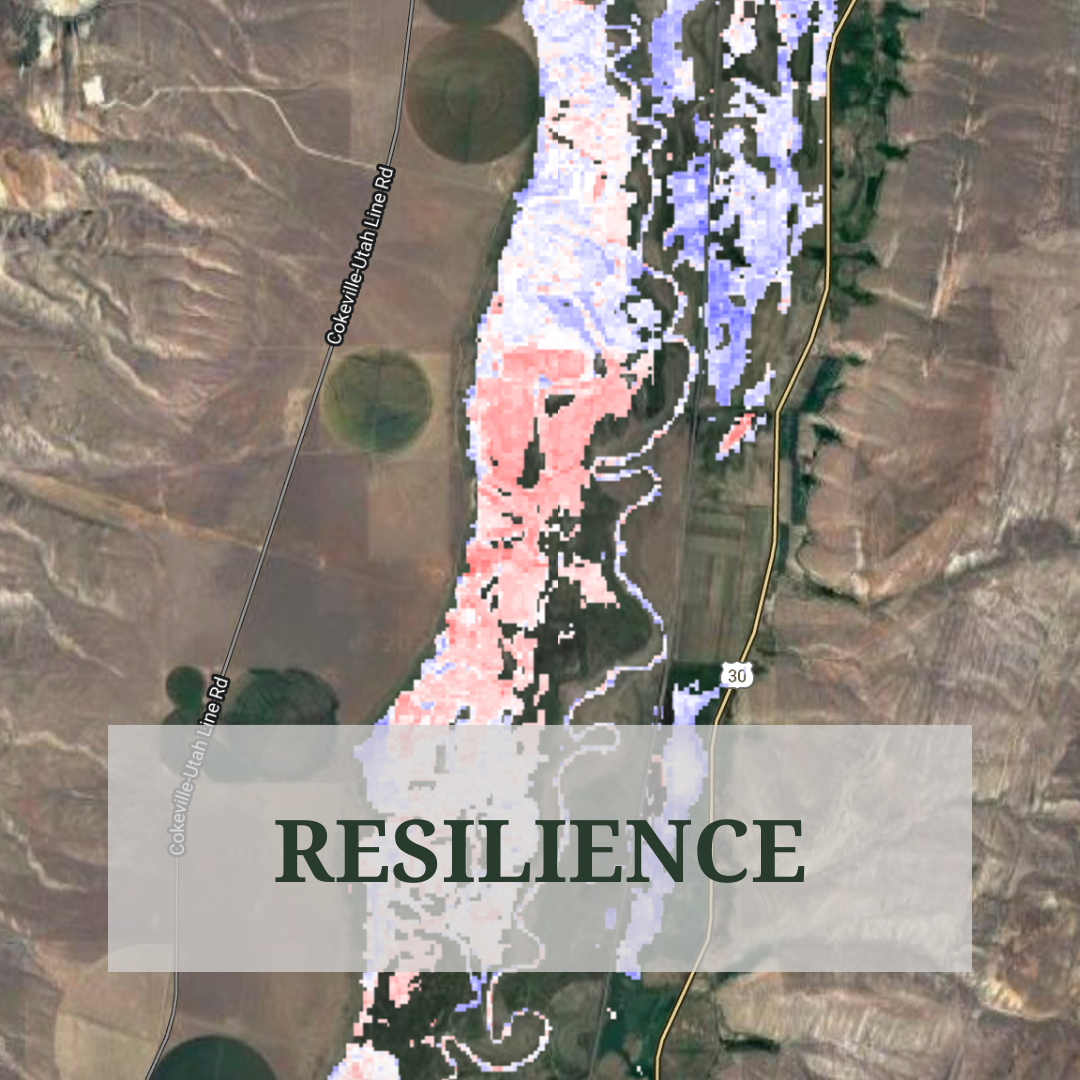
The resilience module allows users to investigate whether surface water is declining, stable, or increasing over time. Users can investigate resilience as long-term surface-water trends (1984-2021) in temporary, seasonal, and semi-permanent wetlands. This information can be useful for managers and conservation practitioners as they prioritize habitats for protection or restoration actions.

By evaluating how long a wetland is flooded each year, researchers are able to assign the area a hydroperiod classification (semi-permanently, seasonally, or temporarily flooded). This, in turn, supplies context about the type of habitat it provides across seasons. The Hydroperiod Module allows users to visualize classified wetland hydroperiods in a user-defined place/time, and export graphs showing the change in abundance of these wetlands across years of interest.
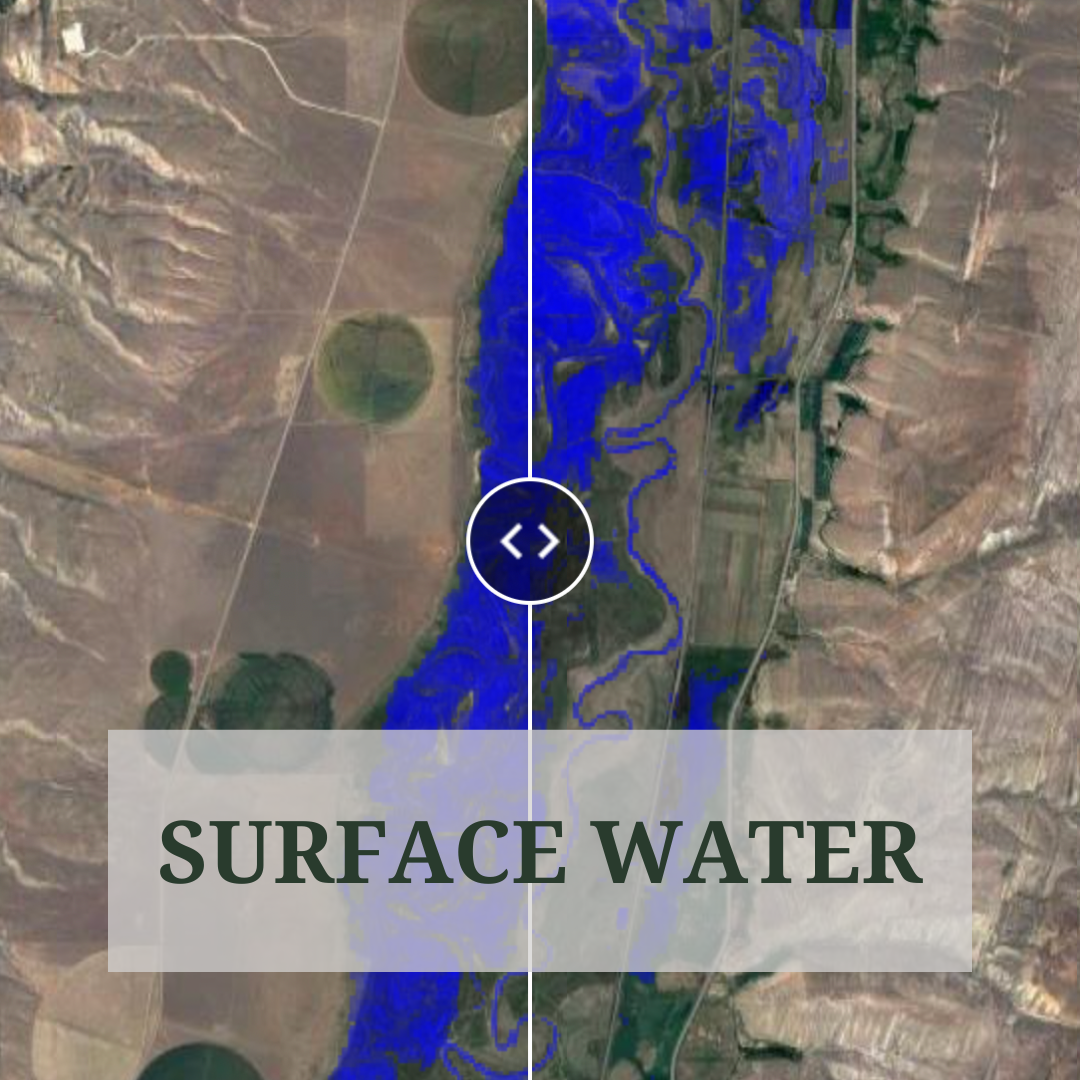
This module enables users to visualize and quantify changes in surface water between time periods of interest. Users can select months/years and use the slider bar for visual comparison, or draw a polygon around their area of interest to calculate the changes in surface water footprint between the two time periods.
Need help navigating? Contact Water 4 Coordinator Erica Hansen or check out our:

WET Around the Web


